Home > User Interface > Overview > Hydrodynamic Database Files Viewer
Hydrodynamic database files viewer
The HDB Viewer is a graphical module which allows to display any data contained in the hydrodynamic database (.HDB) files, such as RAO amplitude and phases, excitation and drifts forces.
This module is invoked by clicking the  icon from the toolbar or from the floater properties window Motion tab. A click on the
button named HDB Viewer will launch the module with the HDB file associated
with your floater.
icon from the toolbar or from the floater properties window Motion tab. A click on the
button named HDB Viewer will launch the module with the HDB file associated
with your floater.
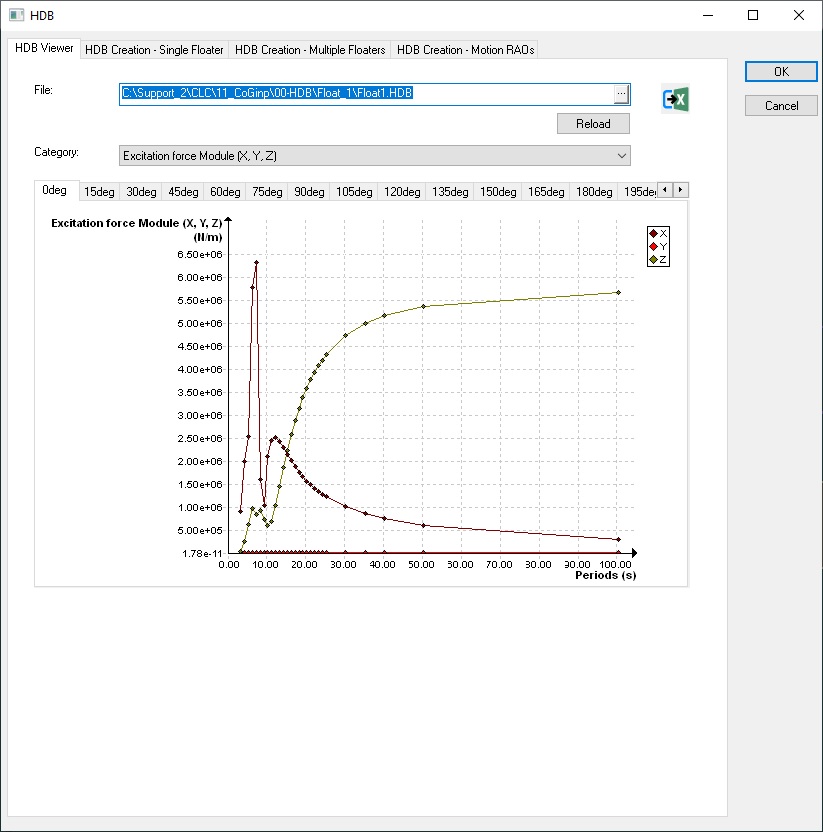
The panel contains the following controls :
-
An edit and browse control File which contains the entire path to the HDB file. A button Reload allows you to re-load the graphics if you change the HDB file in the browser.
-
A list-box named Category with different types of variables listed below.
-
Series of tabs associated with different wave headings.
When selecting a given type of variable, the GUI will display the corresponding values for all the headings and periods found in the HDB file.
The X-axis corresponds to the period and the Y-axis corresponds to the values of the variable. Three curves are plotted on the same graphic (X, Y and Z values or RX, RY and RZ values according to the type of the category) :
-
Excitation force Module (X, Y, Z)
-
Excitation Moment Module (RX, RY, RZ)
-
Excitation force Phase (X, Y, Z)
-
Excitation Moment Phase (RX, RY, RZ)
-
RAO Module (X, Y, Z)
-
RAO Module (RX, RY, RZ)
-
RAO Phase (X, Y, Z)
-
RAO Phase (RX, RY, RZ)
-
Interpolated RAO Module (X, Y, Z)
-
Interpolated RAO Phase (X, Y, Z)
-
Drift Force Module (X, Y, Z)
-
Drift Moment Module (RX, RY, RZ)